Before / after
A photo when the tray is served and another at the end of the meal document what is left.

School canteens
Skeal helps local authorities, schools, education teams and collective catering measure preferences and food waste without adding weight to the canteen service.
For your teams
Skeal helps teams make meal observations more consistent and useful.
A photo when the tray is served and another at the end of the meal document what is left.
Results are organised by dish and by meal to make trends easier to read.
Analyses can be reviewed and corrected: professionals remain in control.
A continuous workflow
The workflow fits the meal moments: service, clearance, then data review.
Dishes and the required meal information are available in the app.
A photo before and after the meal documents consumption.
The portal makes relevant information visible to authorised teams.
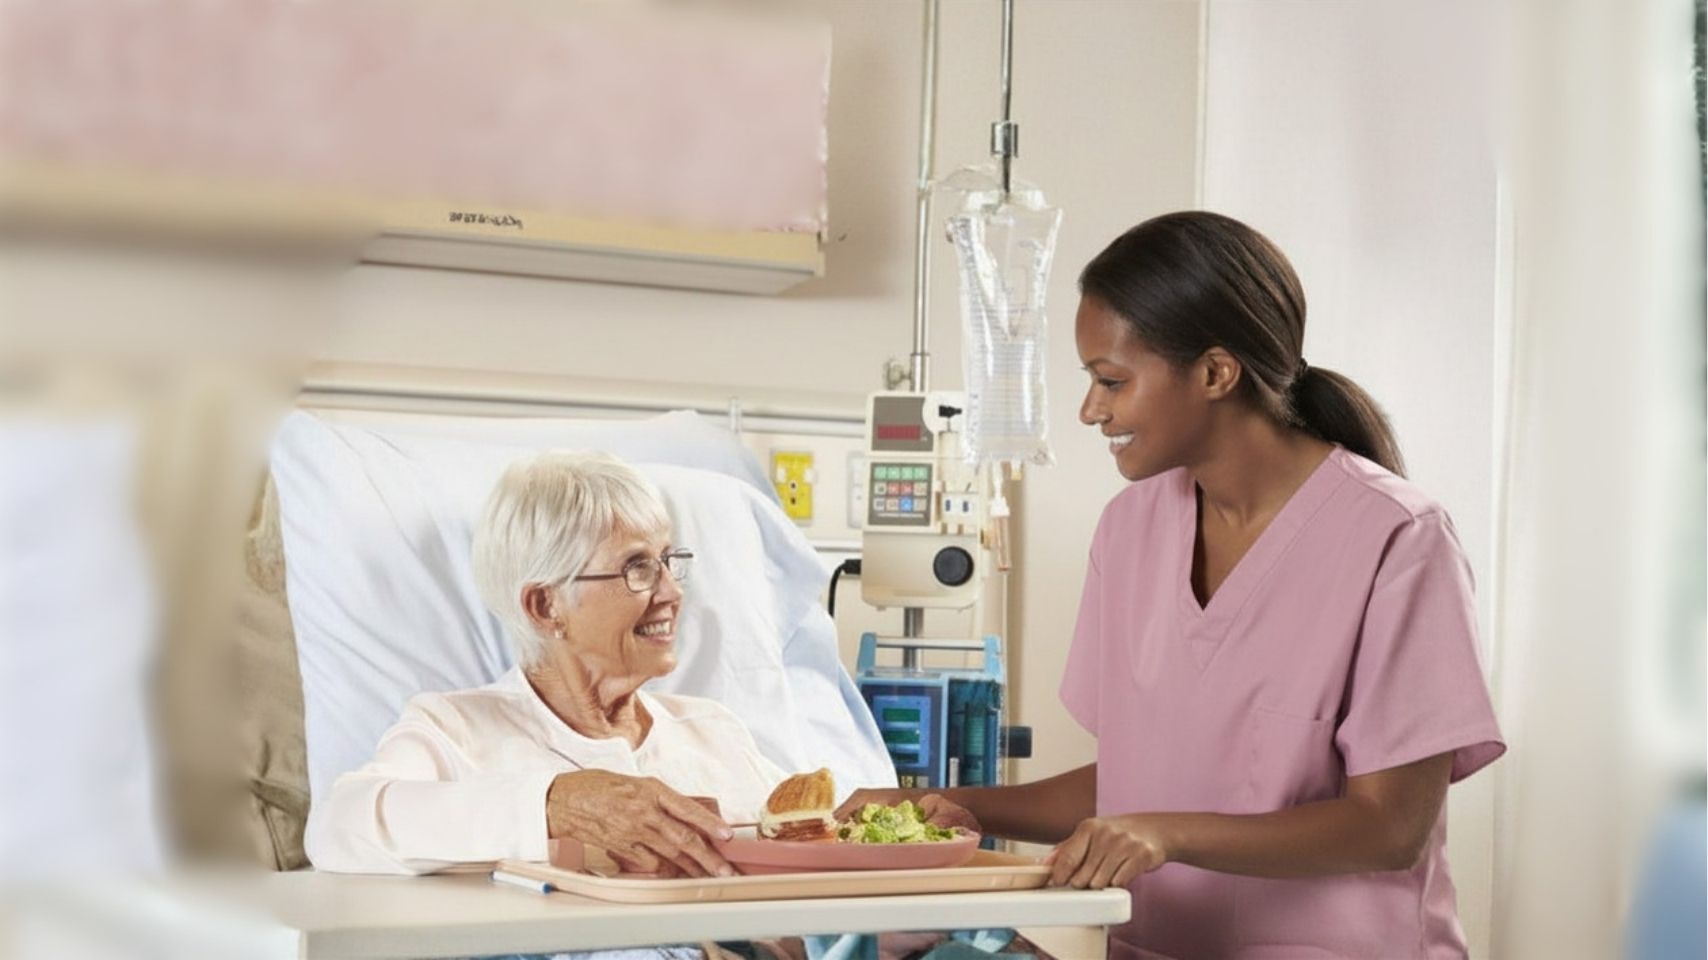
A shared view
The portal helps teams follow consumption trends and share the same information across the ward, dietetics and food service.
Plate observation
The dish choices offered at the buffet and the quantities left at clearance reveal menu acceptance. Yet estimates remain difficult to compare from one meal to the next.
Skeal documents plates before and after the meal to make collective trends visible and food waste precise.
Less-consumed dishes provide a concrete signal for evolving menus and portions while optimising intake and variety around what really works.
Sources: European Commission (JRC) · EU FUSIONS Project · Silvennoinen et al., Food waste in school catering.meals measured
by CNRS
+ Waste measured by CNRS with Skeal across 10 Paris schools.
For your teams
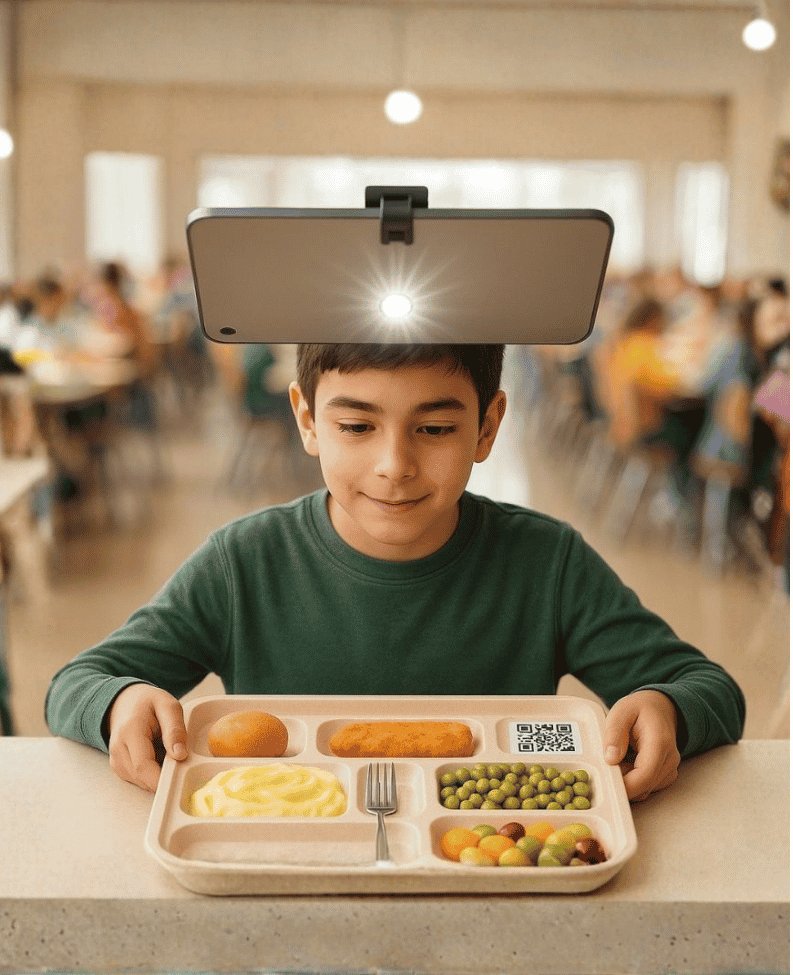
Skeal adapts to a linear self-service process, with one capture point at the end of the line and another at clearance (sorting bins).
Swipe to see all 4 steps →
Menus imported automatically tell Skeal which choices are offered each day. Each selection on the tray is then recognised precisely.
At the end of the self-service line, a fixed mobile tablet captures a photo in 3 seconds, without staff intervention or blocking the tray flow.
Knowing the menu, each dish is linked to a food category and its consumed share is analysed individually, dish by dish.
Kitchens and management use macro-to-micro analysis to understand satisfaction, assess quality, decide and act precisely.
A continuous workflow
With a simple digital tablet, Skeal fits naturally into the meal flow, without heavy investment or complex training.
Import menus and their components. Skeal structures dishes, categories and portions to make meals comparable over time.
At the end of the line and at the clearance station, a QR code on the tray automates capture so every served and cleared situation is recorded quickly and correctly.
Our AI measurements are consolidated in the Skeal portal. Teams access collective consumption trends and correction recommendations.
Dish acceptance
Skeal gives food-service teams a concrete view of meal acceptance. Plates become actionable data for understanding which dishes, portions and menus work.
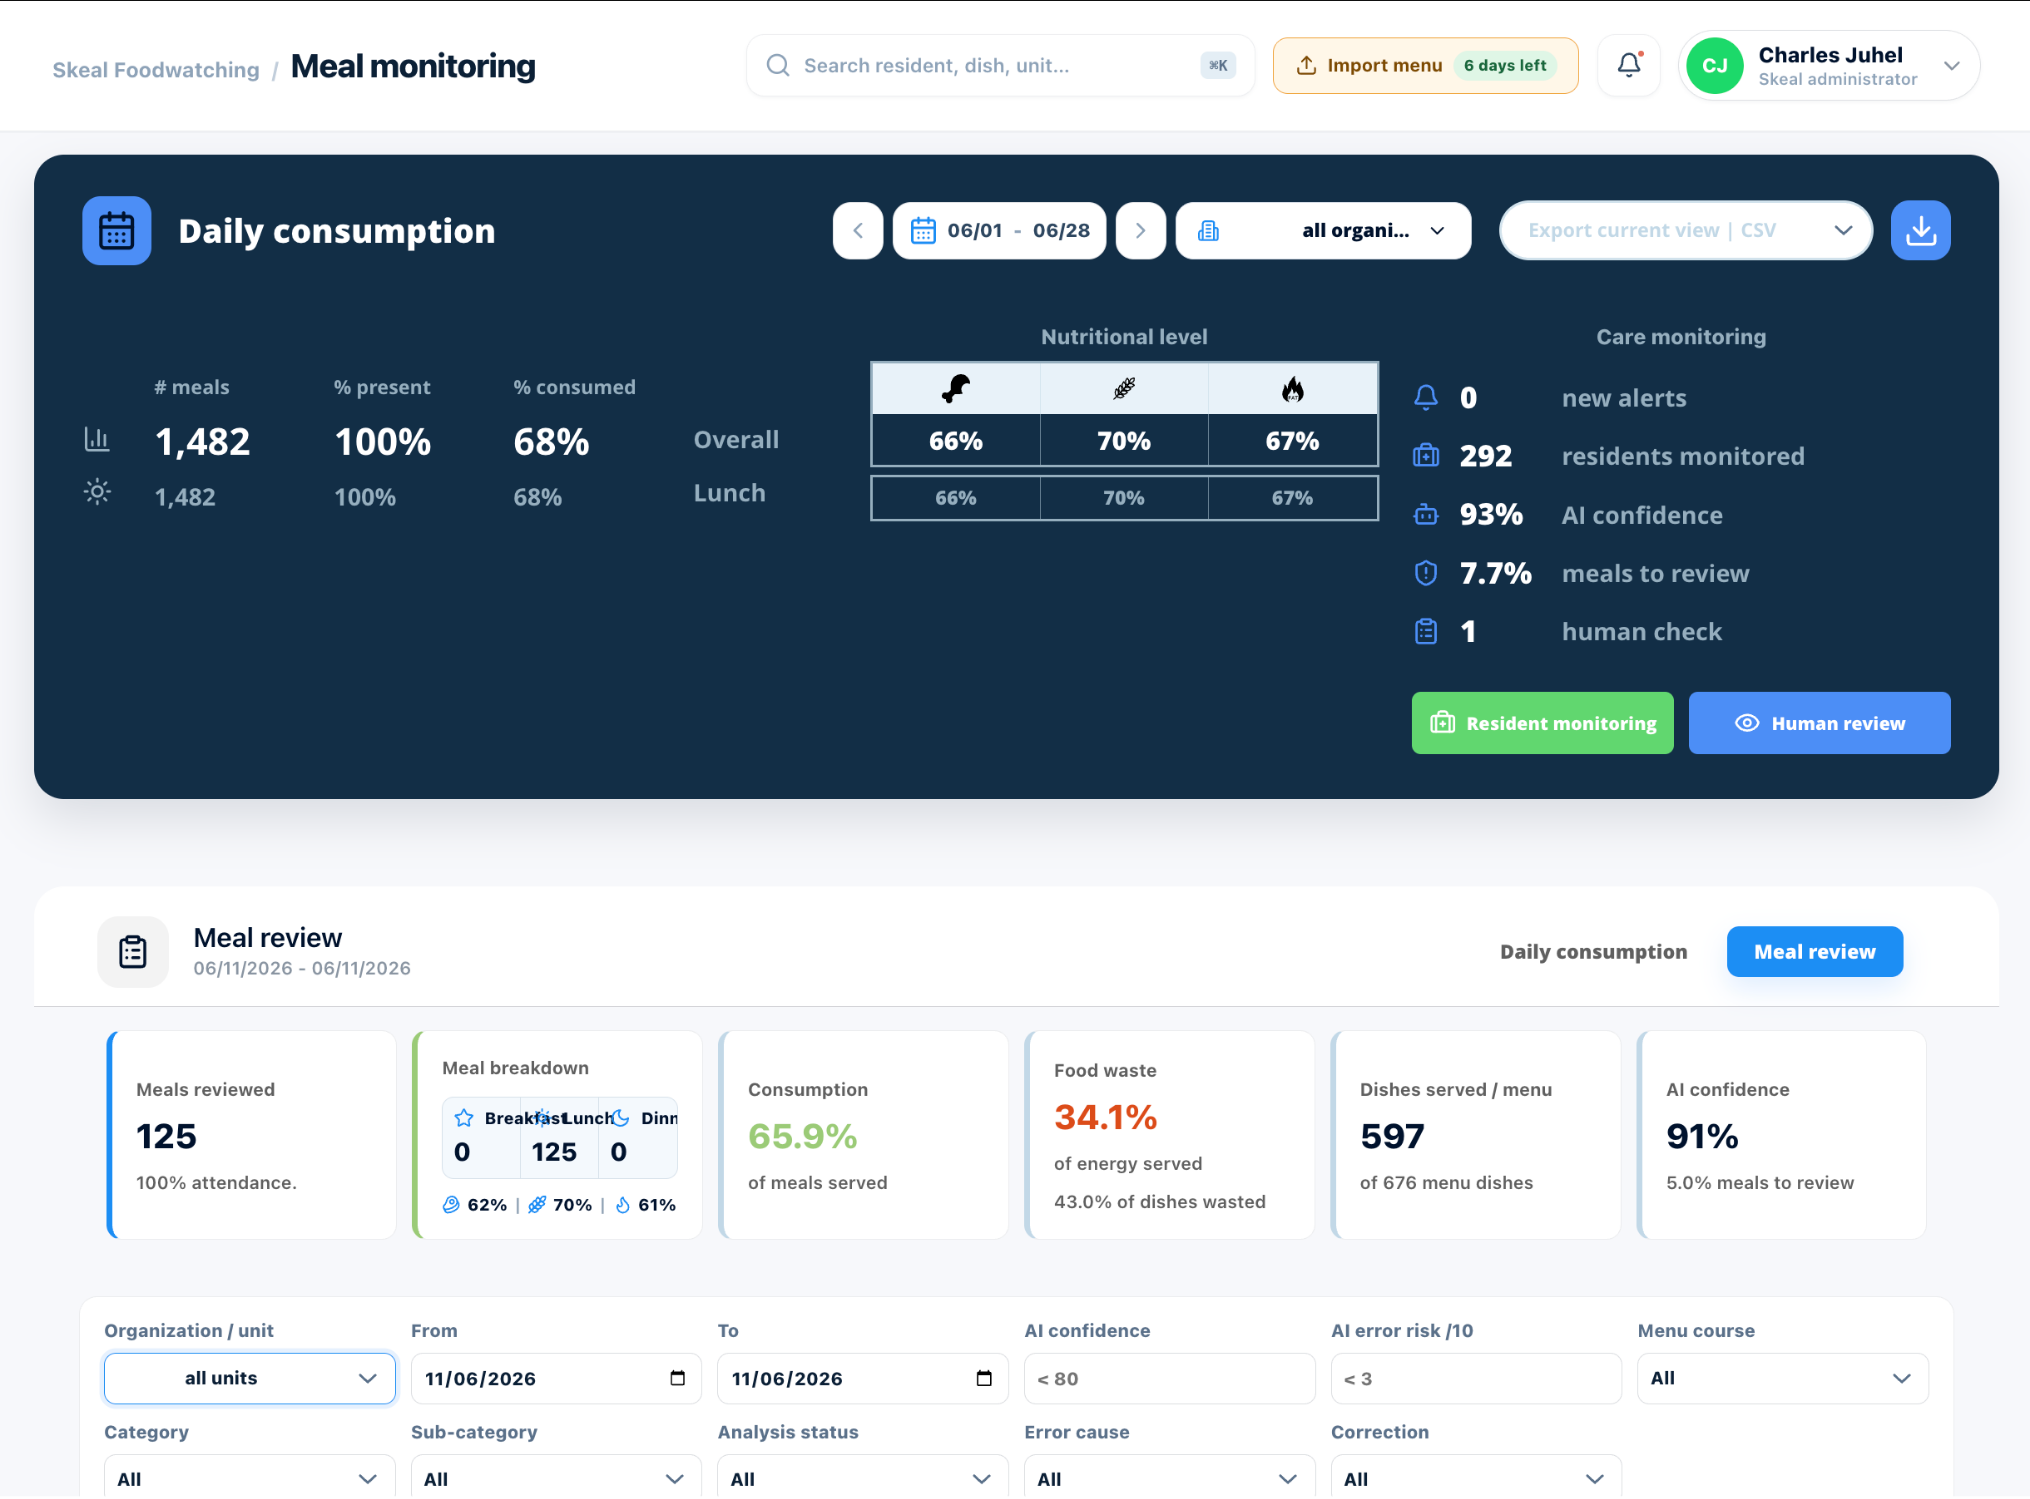
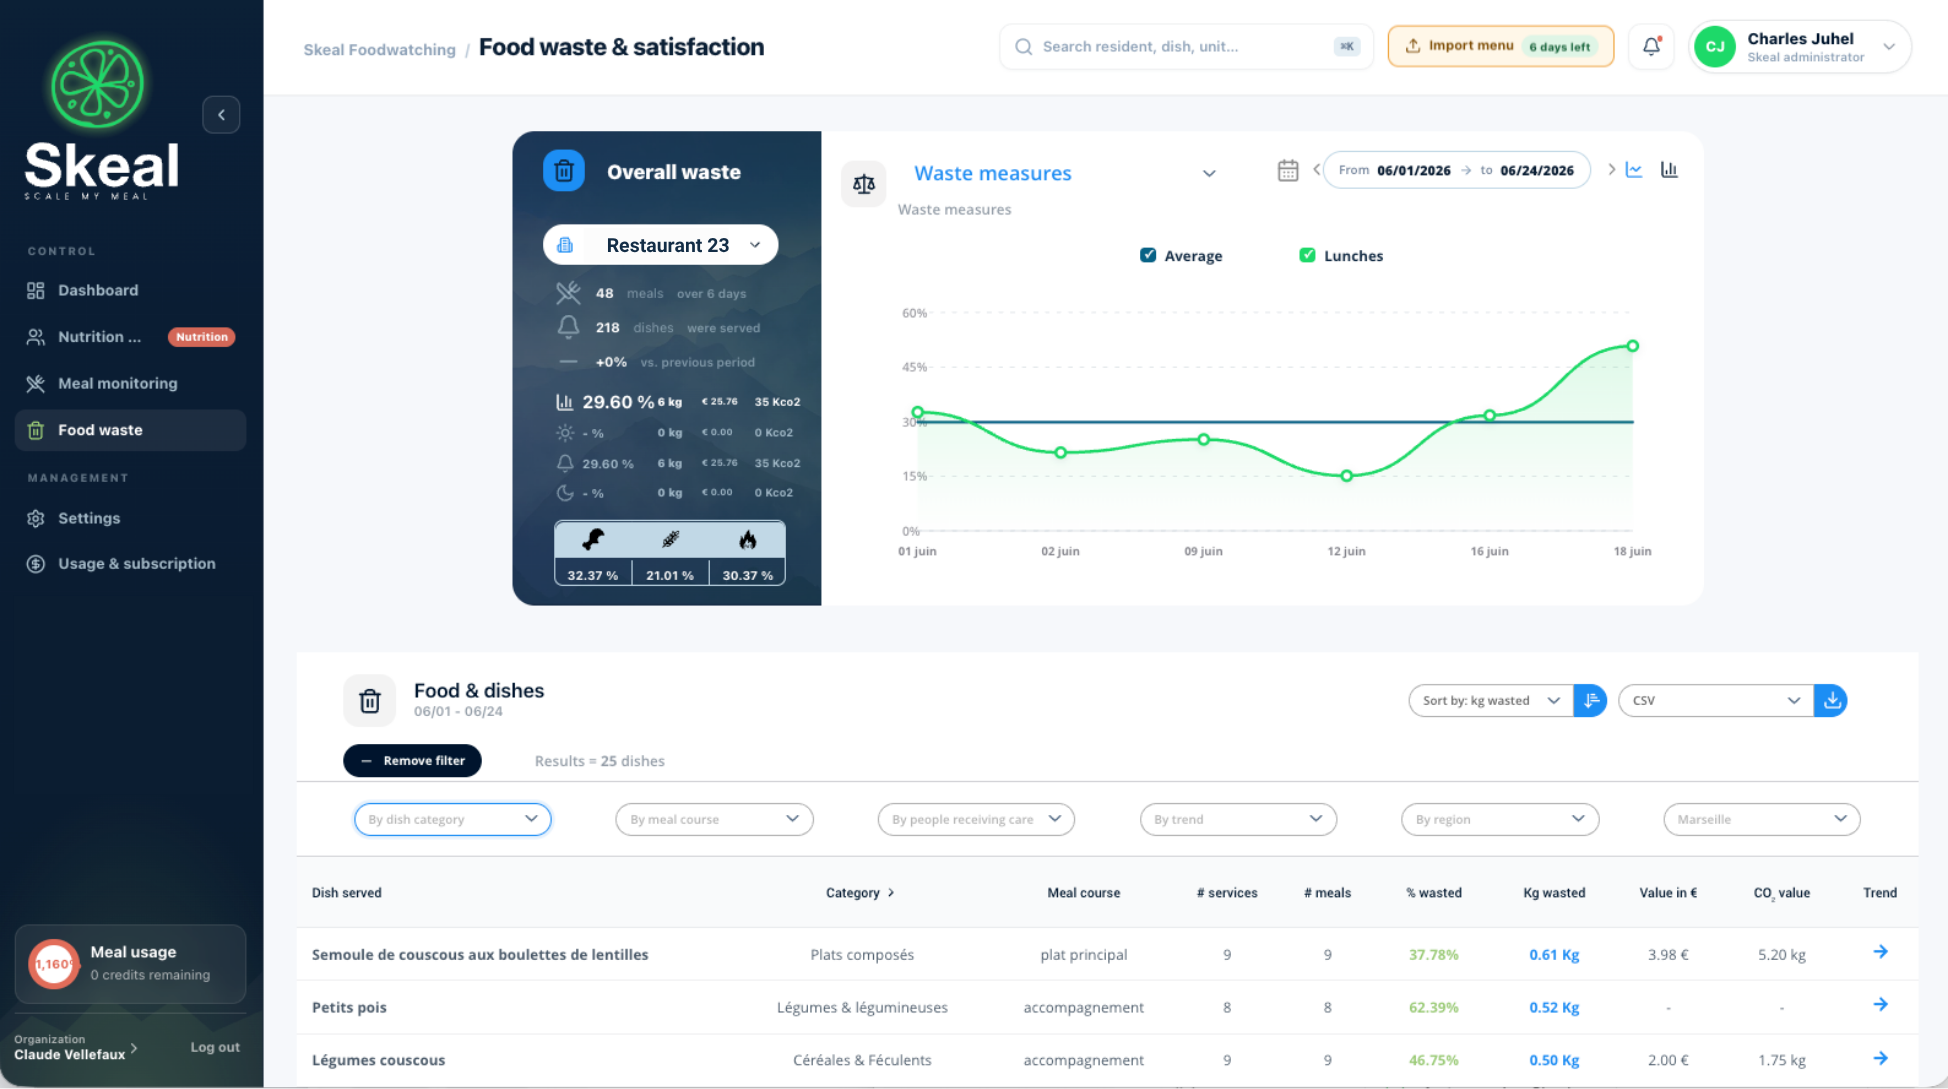
Food-service performance
The same data helps food-service teams understand what is really happening on the plate. It identifies dishes, portions and menus that generate leftovers.
One plate produces data useful for meal quality and school food-service performance.
In video
Tray data helps identify the dishes and portions that leave the most leftovers.
Evidence & references
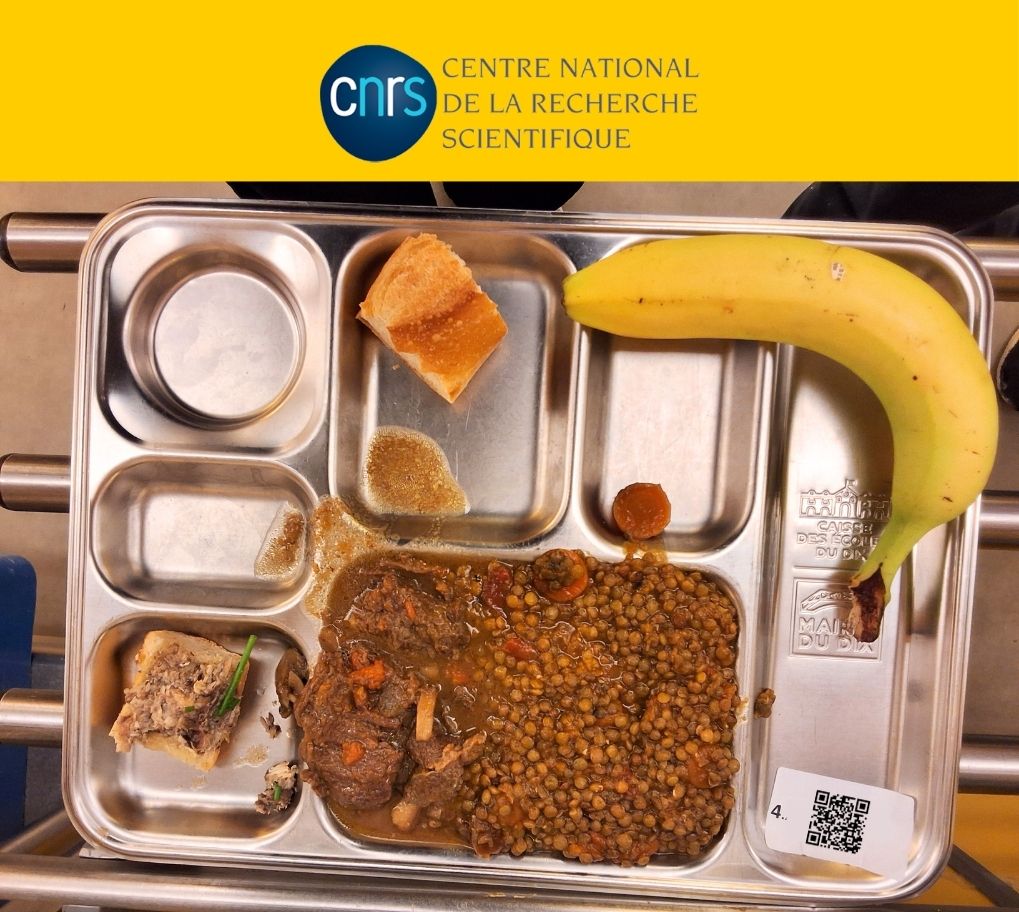
With 350 trays assessed each day across 10 primary schools, CNRS and Skeal adapted the process for rapid, automated measurement. 5,690 meals recorded, 26,000 dishes analysed and 36% waste measured made menu acceptance and leftovers visible without adding weight to the observation process.
FAQ
No. Monitoring can be set up collectively and anonymously, according to the chosen organisation.
Yes. Teams retain the ability to review and correct results according to configured permissions.
Yes. Deployment can start in one canteen or with selected meals before a wider rollout.